Jill-Jênn Vie
Researcher at Inria
% Information geometry & adaptive assessment % JJ Vie % \includegraphics[height=1cm]{figures/inria.png} — handout: true header-includes: - \usepackage{bm} - \usepackage{booktabs} - \usepackage{tikz} - \DeclareMathOperator\logit{logit} - \newcommand\mycite[3]{\textcolor{blue}{#1} “#2”.~#3.} —
JJV
\centering \begin{tikzpicture}[xshift=-14cm,xscale=0.7] \draw (6,0) – node[above,label={below:Lyon}] {Bachelor} (9,0); \draw (9,1) – node[above,label={below:Paris}] {Master(s)} (14.5,1); \draw (14,0) – node[above,label={below:Paris-Saclay}] {PhD} (16.5,0); \draw (17.5,1) – node[above,label={below:Tokyo \& Kyoto}] {Postdoc} (19.5,1); \only<2>{\draw[red] (13.5,-1) – node[above,label={below:Cachan}] {Agrégation ?!} (14.5,-1);} \draw[->] (6,-2) – (19.5,-2) node[above] {time}; \end{tikzpicture}
SequeL
- Bandit models
- Reinforcement learning
- Learning in nonstationary environments
#
\centering
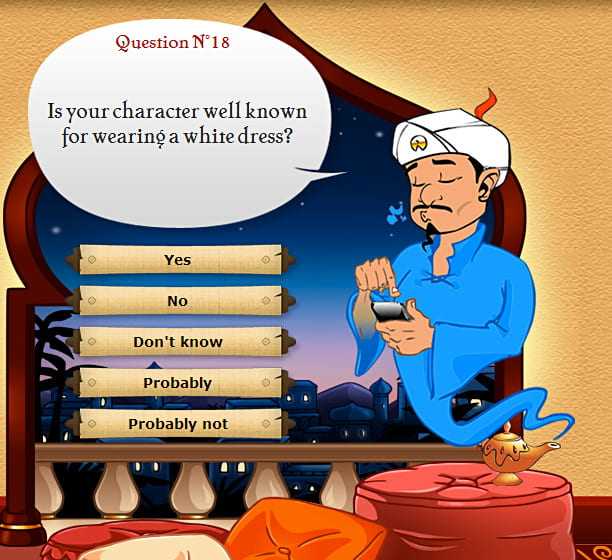
Akinator
\centering
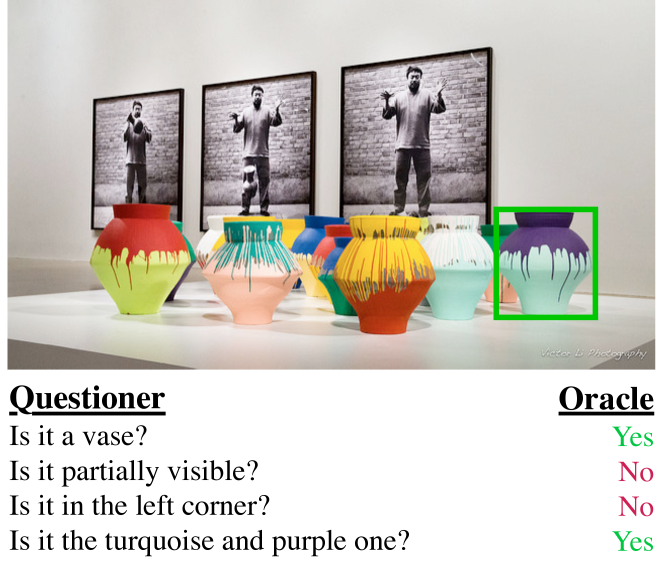
GuessWhat (de Vries et al. 2016)
\centering
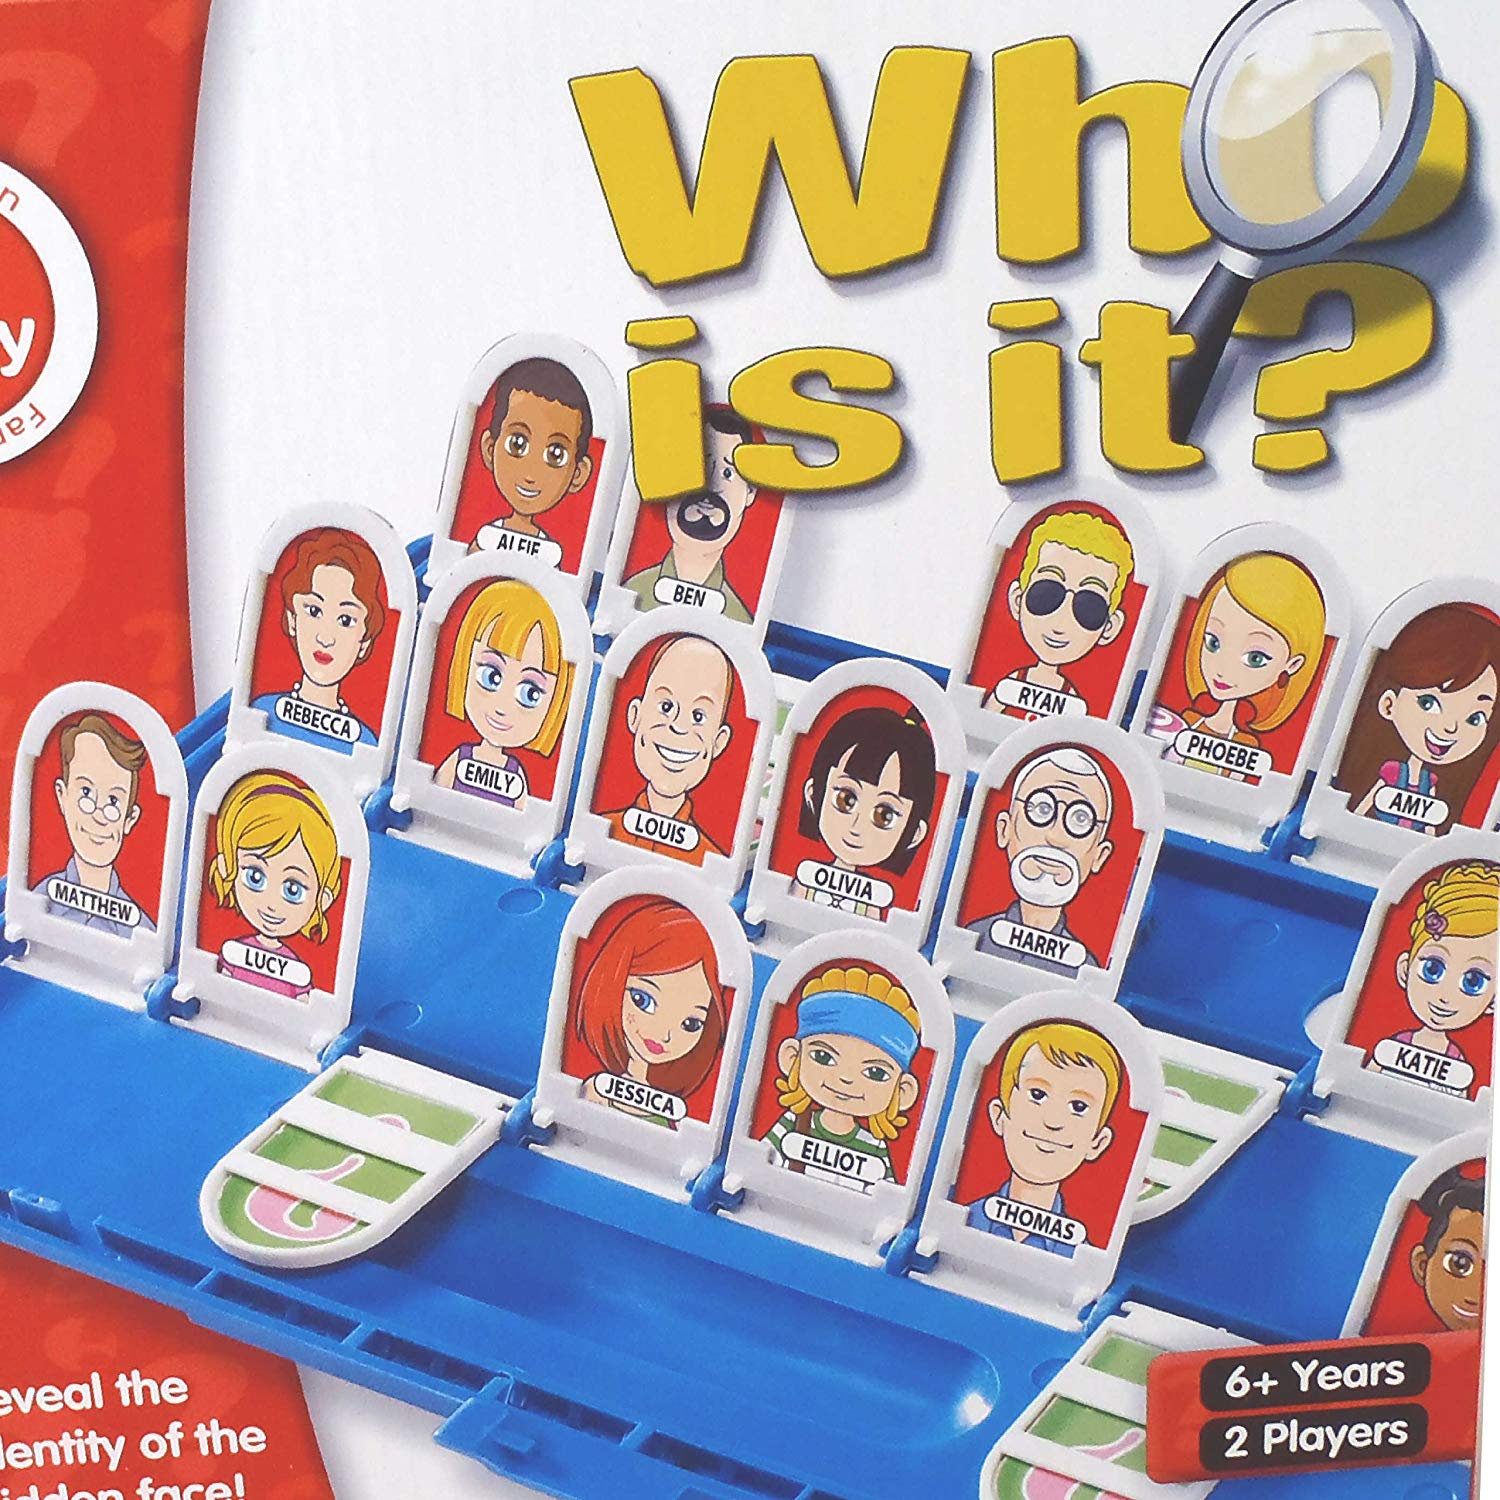
 {width=90%}
Real-world example: certifying digital skills
We want to assess your skills in some domain,
by asking you to complete some tasks.
\centering
\begin{tabular}{rlcccc} \toprule
& & \multicolumn{4}{c}{Knowledge components}
& & \textbf{form} & \textbf{mail} & \textbf{copy} & \textbf{url}\ \midrule
T1 & Send a mail & \textbf{form} & \textbf{mail}
T2 & Fill a form & \textbf{form}
T3 & Share a link & & & \textbf{copy} & \textbf{url}
T4 & Type a URL & \textbf{form} & & & \textbf{url}\ \bottomrule
\end{tabular}
\raggedright \def\correct{\textcolor{green!50!black}{Correct !}} \def\incorrect{\textcolor{red}{Incorrect.}}
\pause
We administer task 1. \correct{}
$\Rightarrow$ \textbf{form} & \textbf{mail} : mastered. Task 2 brings few information.
\pause
We administer task 4. \incorrect{}
$\Rightarrow$ \textbf{url} seems unmastered. Task 3 will bring few information.
Feedback
You seem to master form & mail but not url.
Discrete adaptive assessments
Trying to find a \alert{target} in ${0, 1}^K$ where $K$ is the number of skills.
Maximum entropy: uniform distribution
\alert{Minimizing} the expected entropy
But the support is $O(2^K)$, what to do when $K$ is big?
Structure on the assessed domain (prerequisite graph)
\centering
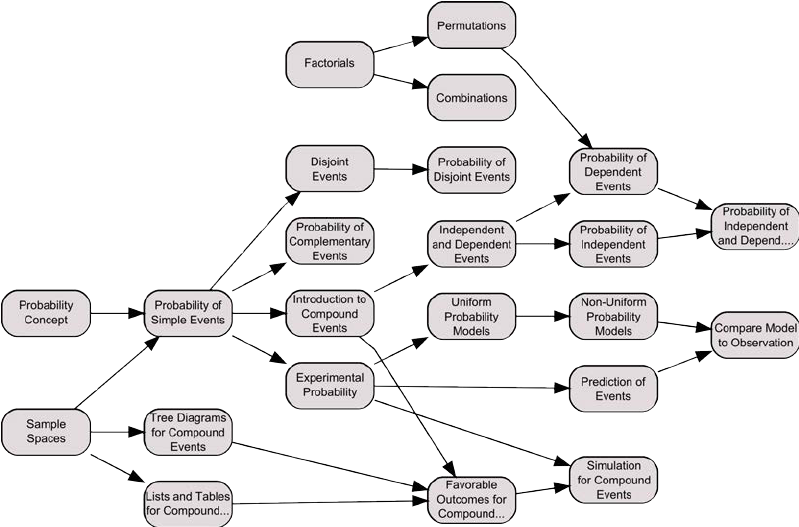
Digital competencies curriculum DIGCOMP 2.0
5 domains, 16 competencies, 800 skills, what should we do?
\centering \includegraphics[width=0.5\linewidth]{figures/digcomp.png}
- Information & data literacy
- Ex. Information retrieval on the Internet
- Communication & collaboration
- Digital content creation
- Safety
- Problem solving
Certification of digital skills
Before: B2i.
Now:
 {width=2cm}
Pix replaces B2i for high school students (JO September 1\textsuperscript{st} 2019) Some companies use it to measure the impact of their trainings
- 1 intrapreneur in the French Ministry of Education
- 3 researchers designing challenges
- 2 developers
- +1 adaptive assessment designer
An example of Pix challenge
\centering \Large
In the French village of Montrésor,
what street is crossing Perrières street?
\vspace{1cm} \pause
\normalsize $\rightarrow$ can get skill \@rechercheInfo3
Different tests, different objectives
Placement tests (self-assessment, low stake)
Assess your level adaptively
Know your strong and weak points
Recommend tutorials
Certification tests (high stake)
Few questions to certify a rough estimate
“This person is level 4 in safety.”
Progression tests
“What should I learn next?”
Optimizing human learning
Continuous adaptive assessments
Rasch (1960)
Rasch model
- $R_{ij} \in {0, 1}$ outcome of user $i$ over item $j$ (right/wrong)
- $\alert{\theta_i}$ ability of user $i$
- $\alert{d_j}$ difficulty of item $j$
- Sigmoid $\sigma : x \mapsto 1 / (1 + \exp(-x))$
Training
- Learn $\alert{\theta_i}$ and $\alert{d_j}$ for historical data (maximizing log-likelihood)
- For a new examinee $i$: keep $d_j$ learn $\alert{\theta_i}$
- Initialize $\hat\theta^{(0)} = 0$
- For each time $t = 0, \ldots, T - 1$:
- Ask \alert{informative} question w.r.t. student ability $\hat\theta^{(t)}$
- Update student ability $\hat\theta^{(t + 1)}$ (maximum likelihood estimate)
Adaptive assessment
Combining discrete and Rasch
Ask question that maximizes average number of validated/invalidated skills:
\centering
$\textnormal{Maximize } p(success) N_{validated} + (1 - p(success)) N_{invalidated}$
\raggedright
Code is on GitHub (AGPLv3 license) in JavaScript
\small \fullcite{Vie2017PIX}
Are we really unidimensional?
In language learning, people from different countries have different difficulties.
Continuous multivariate:
Rasch (item response theory)
\[\Pr(R_{ij} = 1) = \sigma(\alert{\theta} - \alert{d}).\]Multidimensional item response theory
\[\Pr(R_{ij} = 1) = \sigma(\langle \bm{a}, \alert{\bm{\theta}} \rangle + b).\]Example of multidimensional adaptive assessment
\[\Pr(R_{ij} = 1) = \sigma(\langle \bm{a}, \alert{\bm{\theta}} \rangle + b).\]Black points are items, red point is user.
\centering \includegraphics[width=0.5\linewidth]{figures/mirt-here.png}
Interpreting the components
\centering \includegraphics[width=\linewidth]{figures/inter1.jpg}
Interpreting the components
\centering \includegraphics[width=\linewidth]{figures/inter2.jpg}
Prior
\centering
Prior + Posterior given $(1, 1)$ is answered correctly
\centering
What information?
| We want to maximize likelihood $\Rightarrow \max LL = \max \log p(X | \theta)$ |
Find the zeroes, or go in the direction of the gradient:
\[\nabla_\theta LL = \frac{\partial LL}{\partial \theta}\]| Property (fun fact): $\mathbb{E}_{p(X | \theta)} \nabla_\theta LL = 0$ |
\pause
| If $Var_{p(X | \theta)} (\nabla_\theta LL)$ is low, the observation is \alert{useless}. |
\pause
Another index for choosing a question:
\[KL(\theta) = \int_{B(\theta, c/\sqrt{n})} KL(\theta||\theta_0) = \int_{B(\theta, c/\sqrt{n})} \mathbb{E}_{p(X|\theta_0)} \log \frac{P(X|\theta_0)}{P(X|\theta)}\]A toy example
| Let’s take the Rasch model $p(X_j | \theta) = \sigma(\theta - d_j) = p_j$ |
$\nabla_\theta LL = X_j - p_j$
$\mathcal{F}(\theta) = - \frac{\partial^2 LL}{\partial^2 \theta} = p_j (1 - p_j)$
Which means the item of maximum Fisher information is the one of probability \alert{closest to $1/2$}, given the current maximum likelihood estimate.
\pause
Other rewards & policies have been considered:
- Having success rate closest to 0.7 (Duolingo)
- $\varepsilon$-greedy : (Clement et al, JEDM 2015)
Here comes a new challenger
How to model \alert{pairwise interactions} with \alert{side information}?
Logistic Regression
Learn a 1-dim \alert{bias} for each feature (each user, item, etc.)
Factorization Machines
Learn a 1-dim \alert{bias} and a $k$-dim \alert{embedding} for each feature
How to model pairwise interactions with side information?
If you know user $i$ attempted item $j$ on \alert{mobile} (not desktop)
How to model it?
$y$: score of event “user $i$ solves correctly item $j$”
IRT
\[y = \theta_i + e_j\]Multidimensional IRT (similar to collaborative filtering)
\[y = \theta_i + e_j + \langle \bm{v_{\textnormal{user $i$}}}, \bm{v_{\textnormal{item $j$}}} \rangle\]\pause
With side information
\small \vspace{-3mm} \(y = \theta_i + e_j + \alert{w_{\textnormal{mobile}}} + \langle \bm{v_{\textnormal{user $i$}}}, \bm{v_{\textnormal{item $j$}}} \rangle + \langle \bm{v_{\textnormal{user $i$}}}, \alert{\bm{v_{\textnormal{mobile}}}} \rangle + \langle \bm{v_{\textnormal{item $j$}}}, \alert{\bm{v_{\textnormal{mobile}}}} \rangle\)
Graphically: logistic regression
\centering
Graphically: factorization machines
\centering
Formally: factorization machines
Learn bias \alert{$w_k$} and embedding \alert{$\bm{v_k}$} for each feature $k$ such that: \(\logit p(\bm{x}) = \mu + \underbrace{\sum_{k = 1}^N \alert{w_k} x_k}_{\textnormal{logistic regression}} + \underbrace{\sum_{1 \leq k < l \leq N} x_k x_l \langle \alert{\bm{v_k}}, \alert{\bm{v_l}} \rangle}_{\textnormal{pairwise interactions}}\)
Multidimensional item response theory: $\logit p(\bm{x}) = \langle \bm{u_i}, \bm{v_j} \rangle + e_j$
is a particular case.
\small \fullcite{rendle2012factorization}
\normalsize Use temporal features
\small \fullcite{KTM2019}
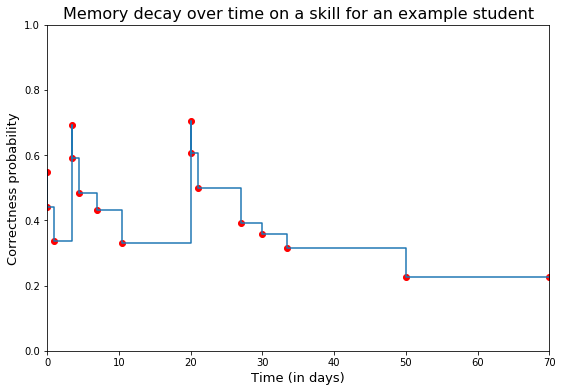
Learners evolve over time!
Simple assumptions:
-
Uncertainty increases with time (ex. Brownian motion)
-
The more you fail, the more you learn
-
Student is forgetting exponentially
Forgetting model
\centering
 {width=80%}
\small\raggedright \mycite{Benoît Choffin, Fabrice Popineau, Yolaine Bourda, and Jill-Jênn Vie (2019)}{DAS3H: Modeling Student Learning and Forgetting for Optimally Scheduling Distributed Practice of Skills}{Best Paper Award at EDM 2019}
Thank you!
“Information geometry” was coined by Shunichi Amari (RIKEN)
Fisher information defines a \alert{Riemannian metric} on probability distributions
\vspace{1cm}
Questions?