Jill-Jênn Vie
Researcher at Inria
% Privacy-Preserving Tabular Data Generation % Matthieu Doutreligne; Aymeric Floyrac; Pierre-Alain Jachiet; Sein Minn; Tomas Rigaux; \alert{Jill-Jênn Vie} % May 9, 2022 — institute: \includegraphics[width=2cm]{figures/soda.png} colorlinks: true biblio-style: authoryear biblatexoptions: natbib header-includes: - \usepackage{bm} - \usepackage{tikz} - \usepackage{booktabs} - \usepackage{colortbl} - \DeclareMathOperator\logit{logit} - \def\Dt{D_\theta} - \def\E{\mathbb{E}} - \def\logDt{\log \Dt(x)} - \def\logNotDt{\log(1 - \Dt(x))} —
Intro
- It is hard to get access to sensitive data1
- A dataset posted online may be archived forever
- How about having instead access to:
- statistics
- conditional probabilities
- a fake dataset? (ex. for reproducibility)
Outline
- Privacy
- Metrics: utility and re-identification
- Attack models
- Weak: Membership inference
- Strong: Train on real and fake, learn to distinguish the two
Striking facts
People pseudonymize, but it’s not enough
@narayanan2008robust managed to de-anonymize a Netflix pseudonymized dataset of seen movies with IMDb
People $k$-anonymize, but high-dimensional data (e.g. mobility) is rarely $k$-anonymizable
- 4 timestamp-location points are needed to uniquely identify 95\% of individual trajectories in a dataset of 1.5M rows \citep{de2013unique}
- 15 demographic points are enough to re-identify 99.96\% of Americans \citep{rocher2019estimating}
Differentially private graphical models
$\varepsilon$-differential privacy
\[\left|\log \frac{Pr(A(D_1) \in S)}{Pr(A(D_2) \in S)}\right| \leqslant \varepsilon\]for all datasets $D_1$ and $D_2$ that differ on a single element
for all possible subsets $S$ (of $\textnormal{Im } A$)
PrivBayes \citep{zhang2017privbayes}
 {width=50%}
However, we need a dynamic model
Intuition
Knowledge embeddings are safe to be shared
User embeddings however should be drawn from distribution
\centering
 {width=50%}
Example data
\begin{table}[h]
\label{example-dataset}
\centering
\resizebox{\textwidth}{!}{
\begin{tabular}{ccc} \toprule
user ID & action ID & outcome \ \midrule
2487 & 384 & 1
2487 & 242 & 0
2487 & 39 & 1
2487 & 65 & 1 \ \bottomrule
\end{tabular}
\arrayrulecolor{white}
\begin{tabular}{l} \toprule
description \ \midrule
user 2487 got token I'' correct \\
user 2487 got tokenate’’ incorrect
user 2487 got token an'' correct \\
user 2487 got tokenapple’’ correct \ \bottomrule
\end{tabular}
}
\arrayrulecolor{black}
\end{table}
So in our case there are two models:
- Sequence generation (Markov chain, RNN)
- Response pattern generation (IRT, Bayesian networks)
Item response theory for response pattern generation
Ex. $r_{ij}$ is 1 if user $i$ got a positive outcome on action (item) $j$
\[p_{ij} = \Pr(R_{ij} = 1) = \sigma(\theta_i + e_j)\]\noindent where $\theta_i$ is ability of user $i$ and $e_j$ is easiness of action $j$
\vspace{1cm}
Trained using Newton’s method: minimize log-loss $\mathcal{L} = \sum_{i, j} (1 - r_{ij}) \log (1 - p_{ij}) + r_{ij} \log p_{ij}$
Logistic regression with sparse features
Let us encode the event (user $i$, item $j$) as a two-hot vector $\bm{x}$:
\centering
$p_{ij} = \sigma(\langle \alert{\bm{w}}, \bm{x} \rangle) = \sigma(\sum_k \alert{w_k} x_k) = \sigma(\alert{\theta_i} + \alert{e_j})$
Utility
\centering Practictioners who conduct study on the real and fake dataset should have similar findings
$\downarrow$
Trained model on original dataset should have parameters that are not too far in RMSE
\raggedright
We also consider weighted RMSE:
\[wRMSE = \sqrt{\sum_{i = 1}^N w_i (d_i - \widehat{d_i})^2}\]where $w_i \in [0, 1]$ is the frequency of action $i$ in the training set.
Reidentification
\centering It should not be easy to re-identify people / the fake dataset should not leak too much information about participants
$\downarrow$
An attacker has to guess, from a broader population, who was in the training set
\centering \begin{tikzpicture}[ xscale=3, yscale=2, data/.style={draw}, >=stealth ] \node[data] (original) at (0,0) {Original}; \node[data] (training) at (1,0) {Training set}; \node[data] (fake) at (1,-1) {Fake set}; \node[data,text width=1.6cm,text centered] (real-irt) at (2,0) {Real item params $d$}; \node[data,text width=1.6cm,text centered] (fake-irt) at (2,-1) {Fake item params $\hat{d}$}; \draw[->] (original) edge node[above=3mm] {sampling half users} (training); \draw[->] (training) edge node[right] {generator} (fake); \draw[<->] (real-irt) edge node[right] {RMSE} (fake-irt); \draw[->,dashed,bend right] (original) edge (training); \draw[->,dashed,bend left=60,text width=2cm,text centered] (fake) edge node[below left] {reidentify\AUC} (training); \draw[->] (training) edge node[above] {IRT} (real-irt); \draw[->] (fake) edge node[above] {IRT} (fake-irt); \end{tikzpicture}
(framework inspired by NeurIPS “Hide and Seek” challenge in healthcare by \cite{jordon2020hide})
Histogram of actions ($y$-axis: frequency)
\centering
Actions
Quantitative results
{width=49%}
{width=49%}
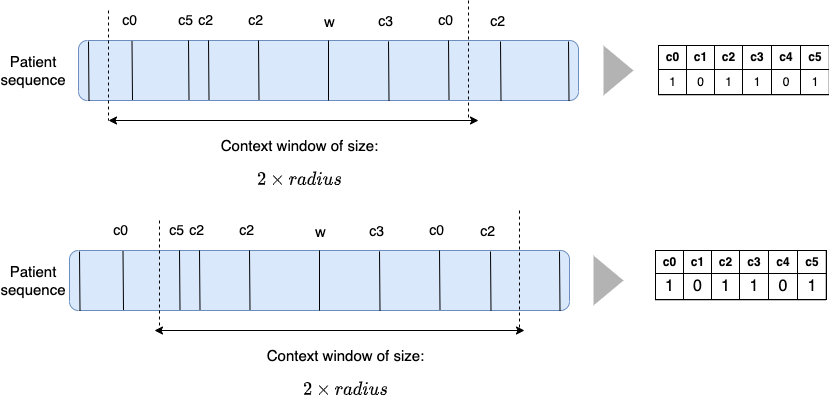
Slided bag of events for SNDS

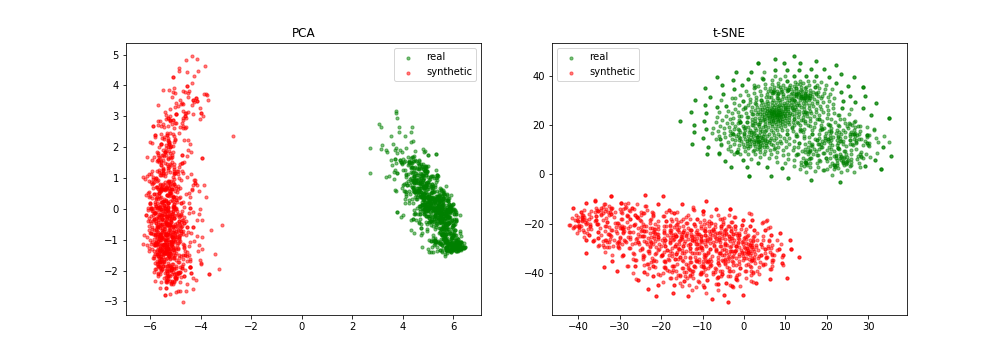
A bad example

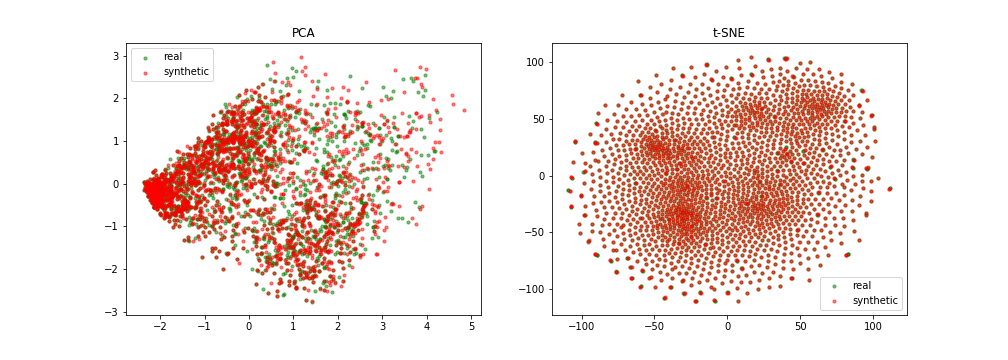
A good example
 {width=100%}
Take home message
- Let’s share the data of people who do not exist
\vspace{1cm}
\pause
Thanks! Questions? \hfill These slides on \href{https://jjv.ie/slides/heka.pdf}{jjv.ie/slides/heka.pdf}
-
Is it for the sake of privacy, safety, or just administrative sadism? ↩