Jill-Jênn Vie
Researcher at Inria
% Using Ratings & Posters\newline for Anime & Manga Recommendations \vspace{2mm} % \alert{Jill-Jênn Vie}¹³ \and Florian Yger² \and Ryan Lahfa³ \and Basile \nolinebreak Clement³ \and Kévin Cocchi³ \and Thomas Chalumeau³ \and Hisashi Kashima¹\textsuperscript4 % ¹ RIKEN Center for Advanced Intelligence Project (Tokyo)\newline ² Université Paris-Dauphine (France)\newline ³ Mangaki (Paris, France)\newline \textsuperscript4 Kyoto University — theme: Frankfurt section-titles: false header-includes: - \usepackage{tikz} - \usepackage{array} - \usepackage{icomma} - \usepackage{multicol,booktabs} - \def\R{\mathcal{R}} handout: true —
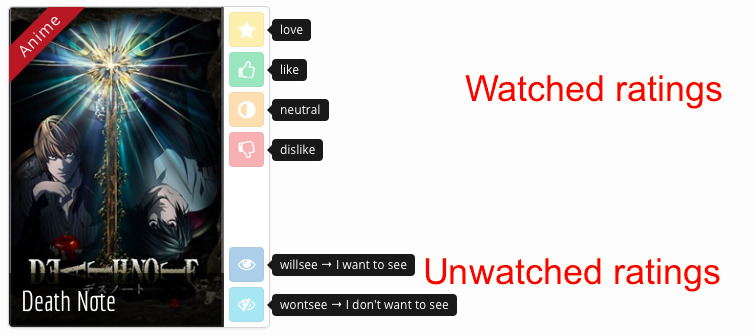
Mangaki
Mangaki
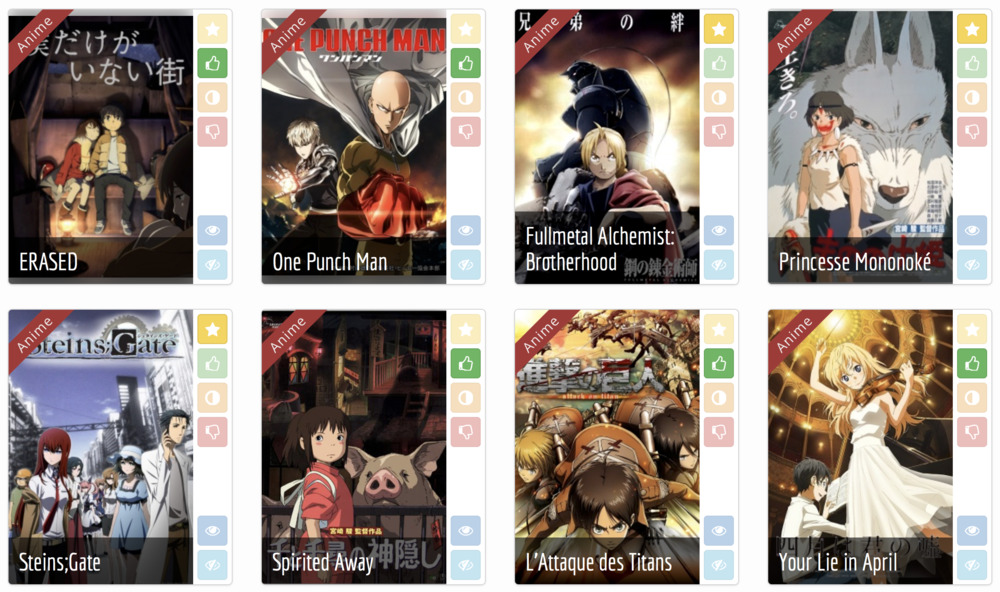
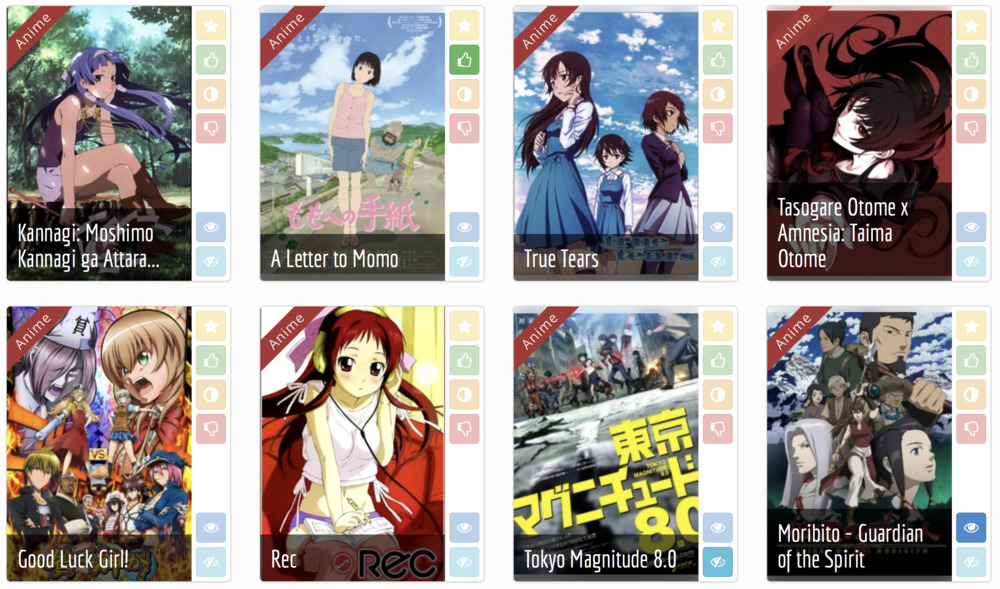
Mangaki, recommendations of anime/manga
Rate anime/manga and receive recommendations
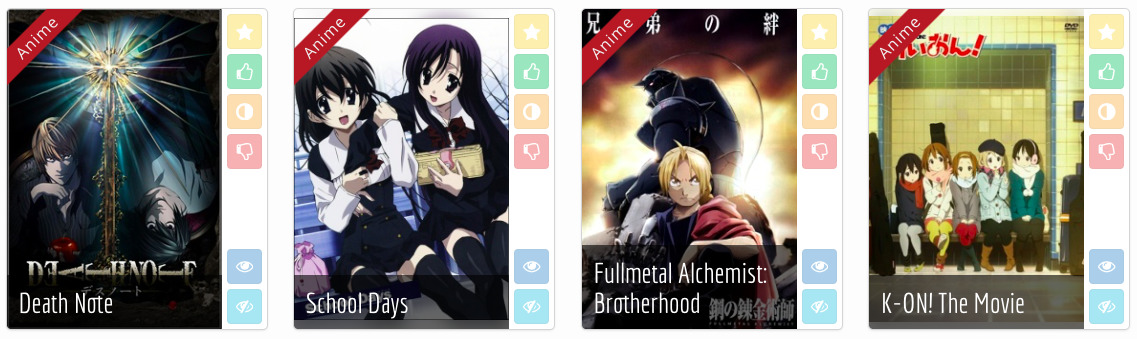
2,000 users, 10,000 anime/manga, 350,000 ratings
- myAnimeList (RIP their API)
- AniDB
- AniList
- (soon) TVtropes
Mangaki
Build a profile
Mangaki prioritizes your watchlist
Browse the rankings: top works
Why nonprofit?
- Why should blockbusters get all the fun/clicks/money?
- Maybe there is one precious, unknown anime \alert{for you}
- and we can help you find it
- Driven by passion, not money
Everything is open source: \alert{\texttt{github.com/mangaki}} (Python, Vue.js)
Awards: Microsoft Prize (2014) Japan Foundation (2016)
Browse the rankings: precious pearls
RIKEN Center for Advanced Intelligence Project
 \
\
- New AI lab near Tokyo Station (opened in 2016)
- 8 accepted papers at NIPS 2017
Authors
 {height=3.1cm}
  {height=3.1cm}
  {height=3.1cm}
  {height=3.1cm}
\begin{minipage}{2.6cm}\centering Jill-Jênn Vie\end{minipage}\begin{minipage}[c]{2.6cm}\centering Florian Yger\end{minipage}\begin{minipage}[c]{2.5cm}\centering Ryan Lahfa\end{minipage}\begin{minipage}[c]{2.6cm}Hisashi Kashima\end{minipage}
- Florian Yger was visiting RIKEN AIP
- Kévin Cocchi & Thomas Chalumeau were interns at Mangaki
Outline
1. Usual algorithms for recommender systems
- Content-based
- Collaborative filtering
2. Our method
- Extracting tags from posters
- Blending models
3. Experiments
- Dataset: Mangaki
- Results
Recommender Systems
Recommender Systems
Recommender Systems
Problem
- Every user rates few items (1 %)
- How to infer missing ratings?
Example
\begin{tabular}{ccccc}
& \includegraphics[height=2.5cm]{figures/1.jpg} & \includegraphics[height=2.5cm]{figures/2.jpg} & \includegraphics[height=2.5cm]{figures/3.jpg} & \includegraphics[height=2.5cm]{figures/4.jpg}
Sacha & ? & 5 & 2 & ?
Ondine & 4 & 1 & ? & 5
Pierre & 3 & 3 & 1 & 4
Joëlle & 5 & ? & 2 & ?
\end{tabular}
Recommender Systems
Problem
- Every user rates few items (1 %)
- How to infer missing ratings?
Example
\begin{tabular}{ccccc}
& \includegraphics[height=2.5cm]{figures/1.jpg} & \includegraphics[height=2.5cm]{figures/2.jpg} & \includegraphics[height=2.5cm]{figures/3.jpg} & \includegraphics[height=2.5cm]{figures/4.jpg}
Sacha & \alert{3} & 5 & 2 & \alert{2}
Ondine & 4 & 1 & \alert{4} & 5
Pierre & 3 & 3 & 1 & 4
Joëlle & 5 & \alert{2} & 2 & \alert{5}
\end{tabular}
Usual techniques
- Content-based
-
\hfill (work features: directors, genre, etc.)
- Linear regression
- Sparse linear regression (LASSO)
- Collaborative filtering
-
\hfill (solely based on ratings)
- $K$-nearest neighbors
- Matrix factorization:
- Singular value decomposition
- Alternating least squares
- Stochastic gradient descent
- Hybrid recommender systems
-
\hfill (combine those two)
- The proposed method
Example: $K$-Nearest Neighbors
\includegraphics{figures/ratings1.pdf}
\includegraphics{figures/knn.pdf}
Example: $K$-Nearest Neighbors
\includegraphics{figures/ratings2.pdf}
\includegraphics{figures/sim.pdf}
Matrix factorization $\rightarrow$ reduce dimension to generalize
\vspace{-7mm}
\(R = \left(\begin{array}{c} \R_1\\ \R_2\\ \vdots\\ \R_n \end{array}\right) = \raisebox{-1cm}{\begin{tikzpicture} \draw (0,0) rectangle (2.5,2); \end{tikzpicture}} = \raisebox{-1cm}{\begin{tikzpicture} \draw (0,0) rectangle ++(1,2); \draw node at (0.5,1) {$C$}; \draw (1.1,1) rectangle ++(2.5,1); \draw node at (2.35,1.5) {$P$}; \end{tikzpicture}}\) \(\text{$R$: 2k users $\times$ 15k works} \iff \left\{\begin{array}{l} \text{$C$: 2k users $\times$ \alert{20 profiles}}\\ \text{$P$: \alert{20 profiles} $\times$ 15k works}\\ \end{array}\right.\) $\R_\text{Bob}$ is a linear combination of profiles $P_1$, $P_2$, etc..
\pause
Interpreting Key Profiles
\begin{tabular}{@{}lccc@{}}
If $P$ & $P_1$: adventure & $P_2$: romance & $P_3$: plot twist
And $C_u$ & $0,2$ & $-0,5$ & $0,6$
\end{tabular}
$\Rightarrow$ $u$ \alert{likes a bit} adventure, \alert{hates} romance, \alert{loves} plot twists.
Weighted Alternating Least Squares (Zhou, 2008)
$R$ ratings, \alert{$U$} user features, \alert{$V$} work features.
\[R = \alert{UV^T} \qquad \Rightarrow \qquad r_{ij} \simeq \hat{r}_{ij}^{ALS} \triangleq \alert{U_i} \cdot \alert{V_j}.\]Objective function to minimize
$U, V \mapsto \sum_{i, j \textnormal{ known}}~(r_{ij} - U_i \cdot V_j)^2 + \lambda \left(\sum_i N_i ||U_i||^2 + \sum_j M_j ||V_j||^2\right)$ where:
- $N_i$: number of ratings by user $i$
- $M_j$: number of ratings for item $j$
Algorithm
Until convergence (~ 10 iterations):
- Fix $U$ find $V$ \hfill (just linear regression $\rightarrow$ least squares)
- Fix $V$ find $U$
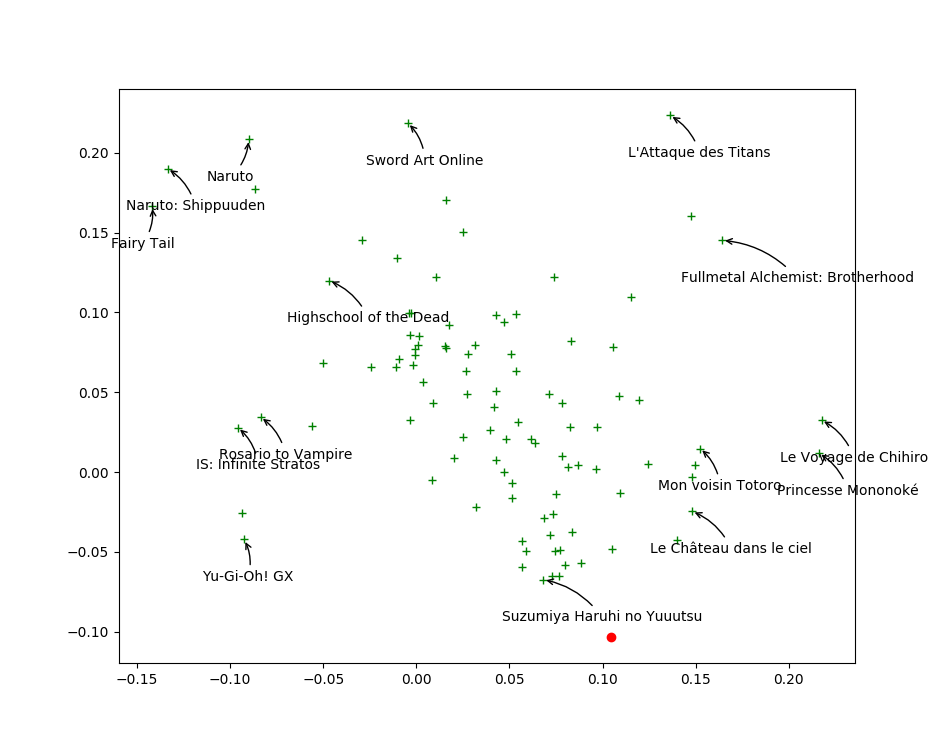
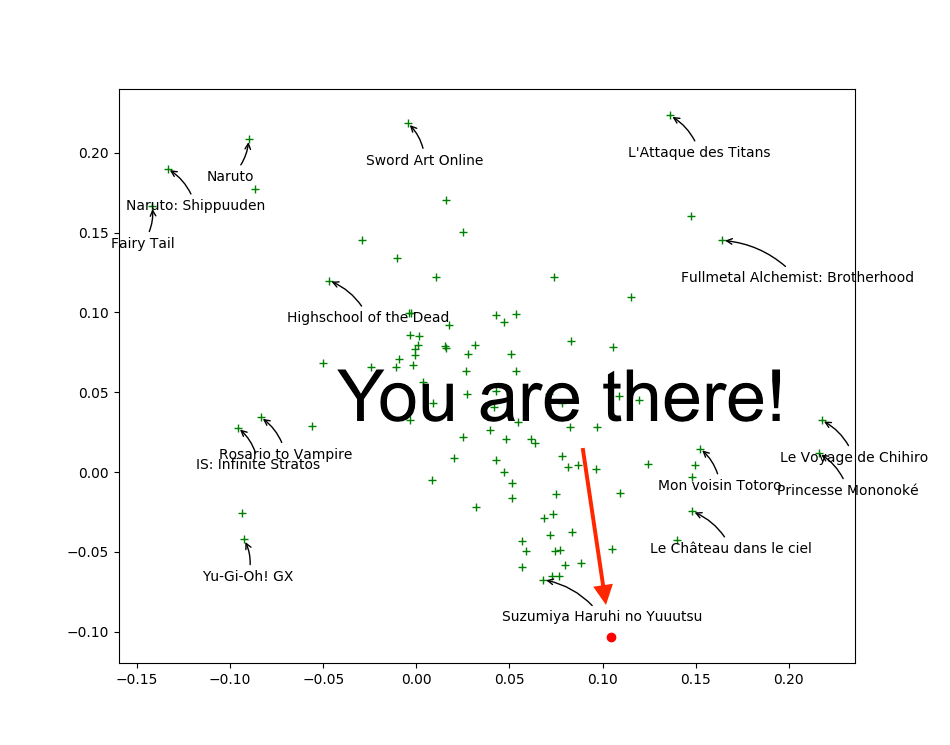
Visualizing first two components of anime $V_j$
\alert{Closer} points mean similar taste
\vspace{-1cm}
 \
\
Find your taste by plotting first two columns of $U_i$
You will \alert{like} anime that are \alert{in your direction}
\vspace{-1cm}
 \
\
Drawback with collaborative filtering
Issue: Item Cold-Start
- If no ratings are available for a work $j$
$\Rightarrow$ Its features $V_j$ cannot be trained :-(
No way to distinguish between unrated works.
\pause
But we have posters!
- On Mangaki, almost all works have a poster
- How to extract information?
Our method
Our method
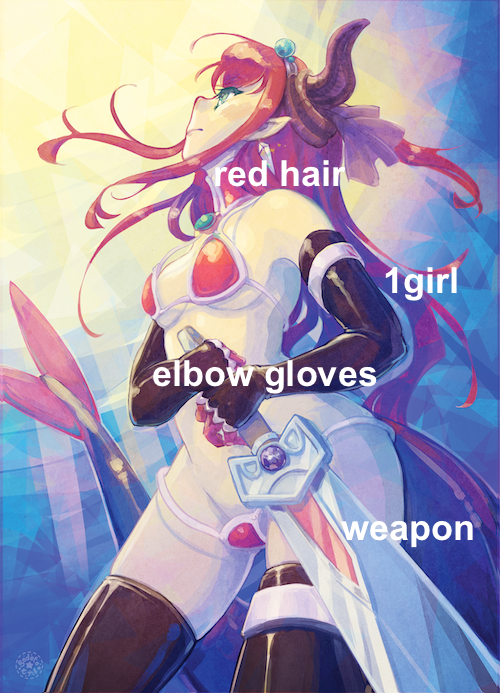
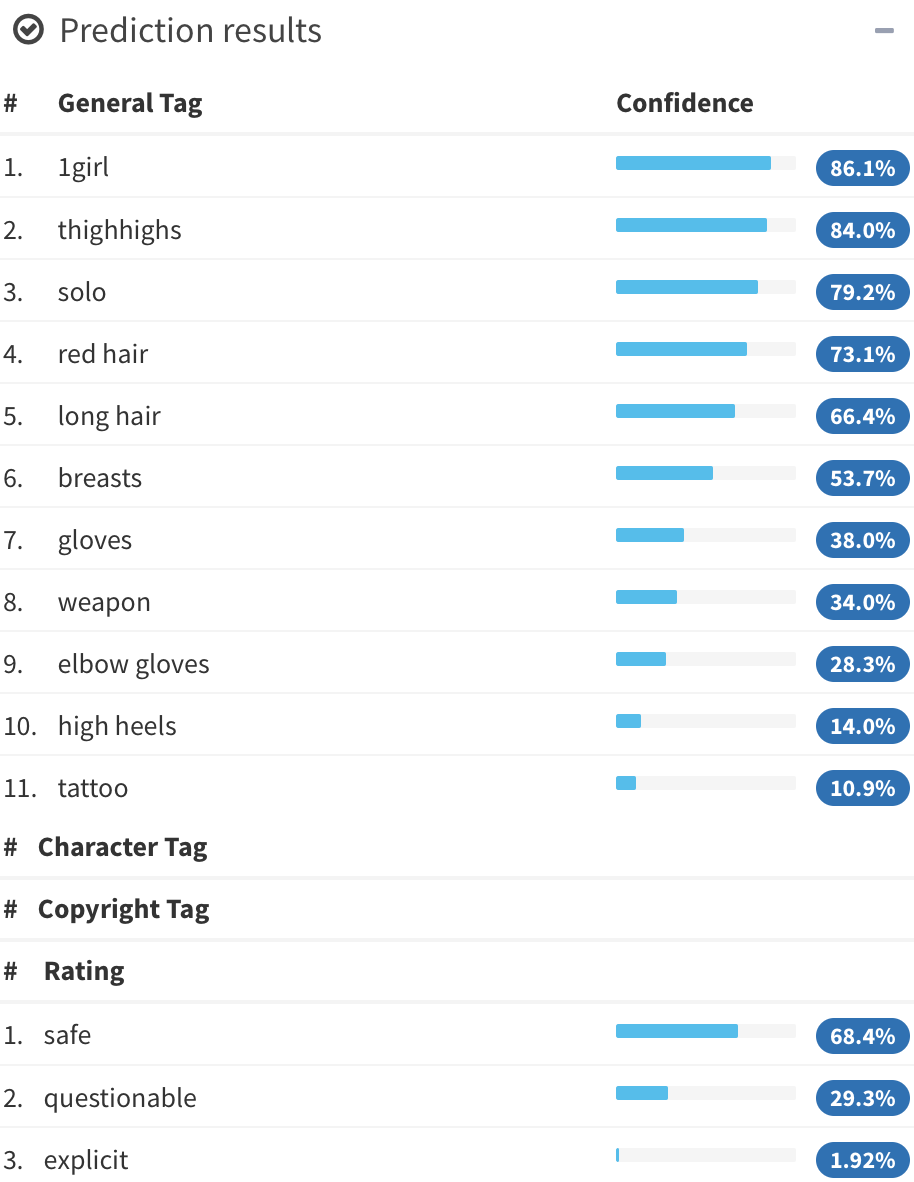
Illustration2Vec (Saito and Matsui, 2015)
\centering
 {width=40%}\
 {width=40%}\
- CNN (VGG-16) pretrained on ImageNet, trained on Danbooru
(1.5M illustrations with tags) - 502 most frequent tags kept, outputs \alert{tag weights}
LASSO for sparse linear regression
$T$ matrix of 15000 works $\times$ 502 tags ($t_{jk}$: tag $k$ appears in item $j$)
- Each user is described by its preferences \alert{$P_i$}
$\rightarrow$ a \alert{sparse} row of weights over tags. - Estimate user preferences \alert{$P_i$} such that \(r_{ij} \simeq \hat{r}_{ij}^{LASSO} \triangleq \alert{P_i} T_j^T.\)
\pause
Least Absolute Shrinkage and Selection Operator (LASSO)
\[P_i \mapsto \frac1{2 N_i} {\lVert \R_i - P_i T^T \rVert}_2^2 + \alpha \alert{ {\lVert P_i \rVert}_1}.\]\noindent where $N_i$ is the number of items rated by user $i$.
\pause
Interpretation and explanation of user preferences
- You seem to like \alert{\emph{magical girls}} but not \alert{\emph{blonde hair}}
$\Rightarrow$ Look! All of them are \alert{\emph{brown hair}}! Buy now!
Combine models
Which model should be choose between ALS and LASSO?
- Answer
-
Both!
- Methods
-
boosting, bagging, model stacking, blending.
- Idea
-
find $\alert<2>{\alpha\only<2>{j}}$ s.t. $\hat{r{ij}} \triangleq \alert<2>{\alpha\only<2>{j}} \hat{r}{ij}^{ALS} + (1 - \alert<2>{\alpha\only<2>{j}}) \hat{r}{ij}^{LASSO}.$
Examples of $\alpha_j$
\centering \includegraphics{figures/curve1.pdf}
Mimics ALS \(\hat{r_{ij}} \triangleq \alert1 \hat{r}_{ij}^{ALS} + \alert0 \hat{r}_{ij}^{LASSO}.\)
Examples of $\alpha_j$
\centering \includegraphics{figures/curve2.pdf}
Mimics LASSO \(\hat{r_{ij}} \triangleq \alert0 \hat{r}_{ij}^{ALS} + \alert1 \hat{r}_{ij}^{LASSO}.\)
Examples of $\alpha_j$
\centering \includegraphics{figures/curve3.pdf} \(\hat{r}_{ij}^{BALSE} = \begin{cases} \hat{r}_{ij}^{ALS} & \text{if item $j$ was rated at least $\gamma$ times}\\ \hat{r}_{ij}^{LASSO} & \text{otherwise} \end{cases}\) But we can’t: \alert{Not differentiable!}
Examples of $\alpha_j$
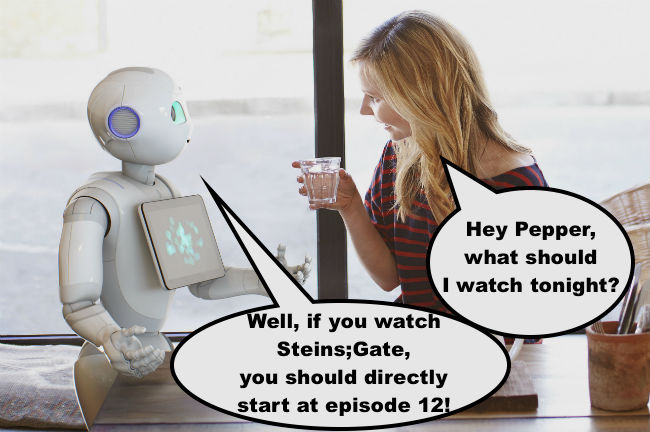
\centering \includegraphics{figures/curve4.pdf} \(\hat{r}_{ij}^{BALSE} = \alert{\sigma(\beta(R_j - \gamma))} \hat{r}_{ij}^{ALS} + \left(1 - \alert{\sigma(\beta(R_j - \gamma))}\right) \hat{r}_{ij}^{LASSO}\) $\beta$ and $\gamma$ are learned by stochastic gradient descent.
We call this gate the \alert{Steins;Gate}.
Blended Alternate Least Squares with Explanation
\centering
Blended Alternate Least Squares with Explanation
Blended Alternate Least Squares with Explanation
Blended Alternate Least Squares with Explanation
Blended Alternate Least Squares with Explanation
Blended Alternate Least Squares with Explanation
Blended Alternate Least Squares with Explanation
Experiments
Experiments
Dataset: Mangaki
\
- 2300 users
- 15000 works \textcolor{gray}{\hfill {\em \small anime / manga / OST}}
- 340000 ratings \textcolor{gray}{\hfill {\em \small fav / like / dislike / neutral / willsee / wontsee}}
Evaluation: Root Mean Squared Error (RMSE)
If we predict $\hat{r_{ij}}$ for each user-work pair $(i, j)$ to test among $n$,
while truth is $r_{ij}$:
Cross-validation
- 80% of the ratings are used for training
- 20% of the ratings are kept for testing
Differents sets of items:
- Whole test set of works
- 1000 works least rated (1.5%)
- Cold-start: works not seen in the training set (only the posters)
Results
\centering
\
Summing up
We presented BALSE, a model that:
- uses information in the \alert{ratings} (collaborative filtering)
- uses information in the \alert{posters} using CNNs (content-based)
- combine them in a \alert{nonlinear} way
to \alert{improve} the recommendations, and \alert{explain} them.
\pause
Further work
- Use latent features (not only tags) of the posters (IJCAI 2016)
- End-to-end training (not separately)
Coming soon: Watching assistant
Thank you! \hfill jj@mangaki.fr
\centering
 {width=50%}\
Try it: \alert{https://mangaki.fr} \hfill Twitter: \alert{@MangakiFR}
\raggedright
Read the article
\small Using Posters to Recommend Anime and Mangas in a Cold-Start Scenario
\normalsize \alert{github.com/mangaki/balse} (PDF on arXiv, front page of HNews)
Results of Mangaki Data Challenge: \alert{research.mangaki.fr}
- Ronnie Wang (Microsoft Suzhou, China)
- Kento Nozawa (Tsukuba University, Japan)
- Jo Takano (Kobe University, Japan)